Fareless Transit Pass Enrollment
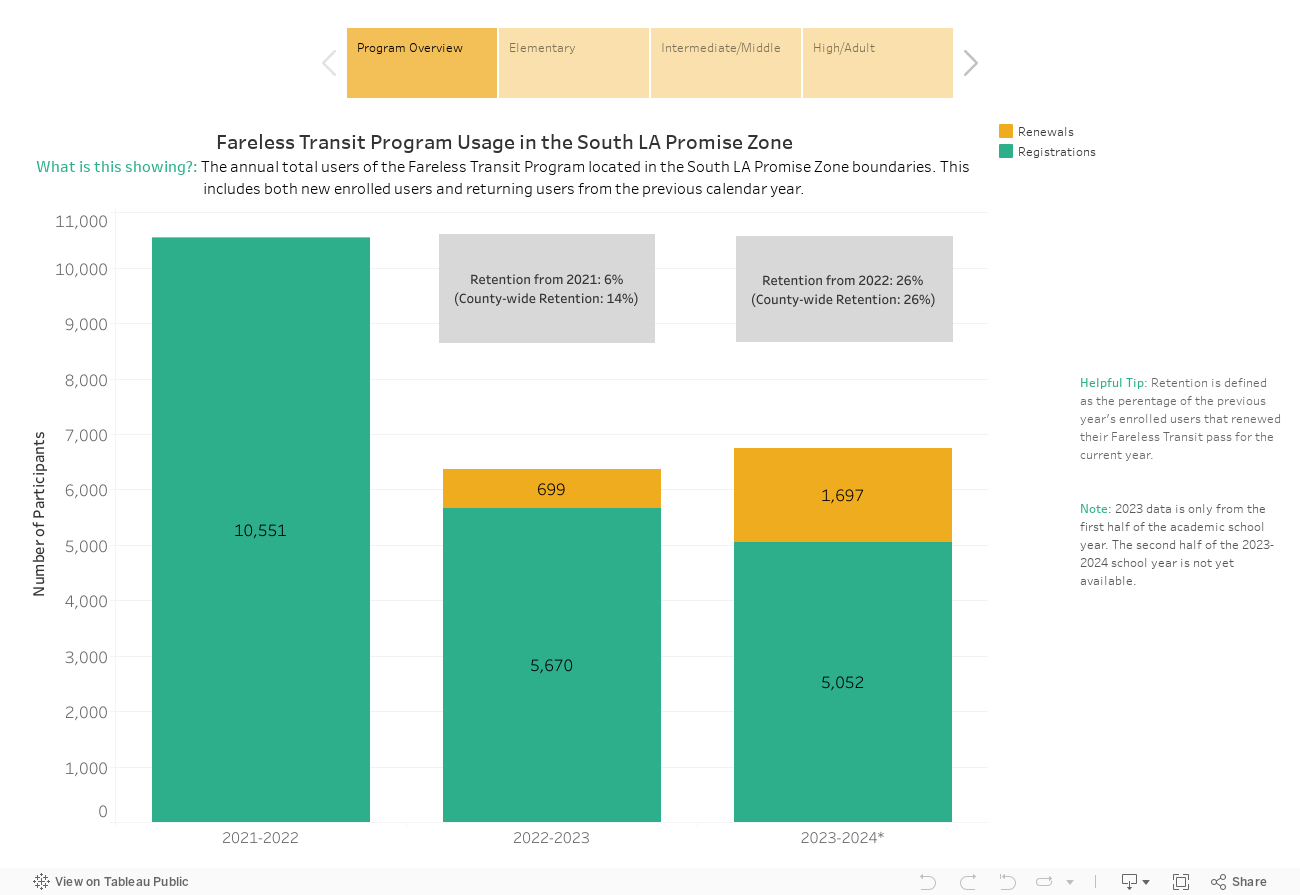
- After the program launched in the middle of the 2021-2022 school year, nearly a quarter of students in South LA Promise Zone schools enrolled in the Fareless Transit program.
- In the second year of the program (2022-2023), just 6% of students in South LA Promise Zone schools renewed their enrollment compared to 14% of students countywide.
- High school students enroll in the program at higher rates than elementary and middle school students in the South LA Promise Zone.
Fareless Transit Pass Usage
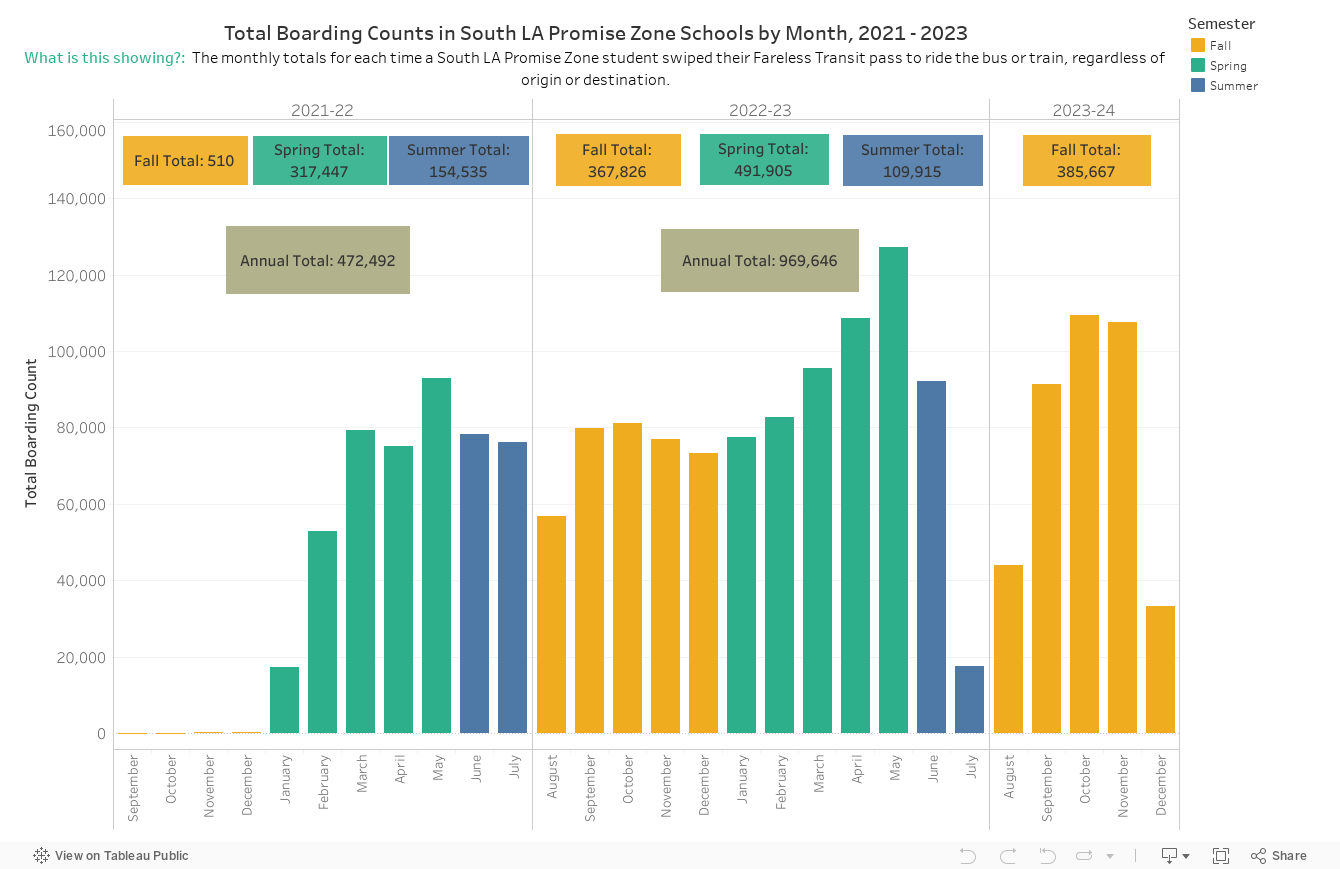
- Students attending schools in the South LA Promise Zone swipe their Fareless Transit Passes more frequently during the school year than the summer months.
- After launching in the middle of the 2021-2022 school year, program usage increased during the 2022-23 school year. South LA Promise Zone students swiped their passes nearly 970,000 times during the 2022-23 school year.
- Boarding data for the 2023-24 school year is incomplete, but the numbers are on pace to surpass previous years.
Cyclist Safety
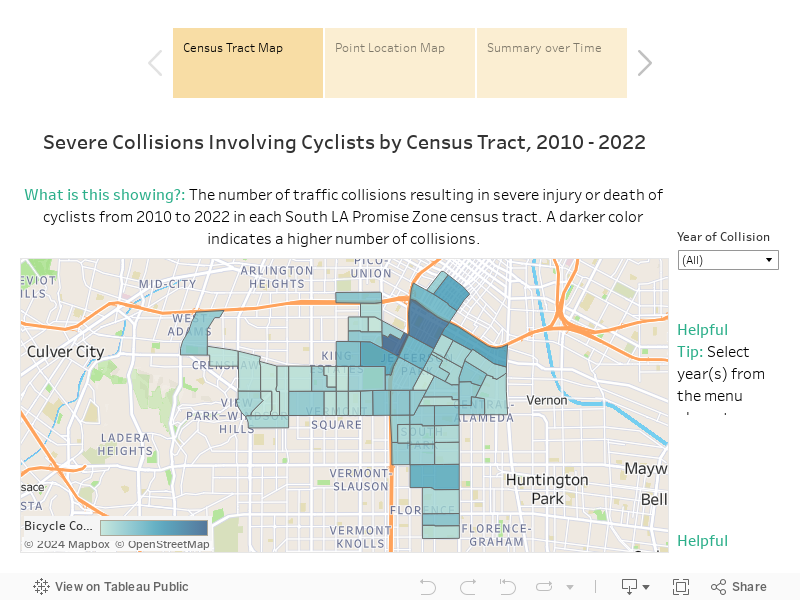
- Over the last decade, the rate of traffic collisions with cyclists has been consistently higher in the South LA Promise Zone than in the larger City of Los Angeles.
- From 2017 to 2021, the number of collisions with cyclists in the South LA Promise Zone has been steadily decreasing. However, this number slightly increased from 2021 to 2022.
- The majority (59%) of collisions with cyclists in the South LA Promise Zone happen on streets without a bike lane.
Pedestrian Safety
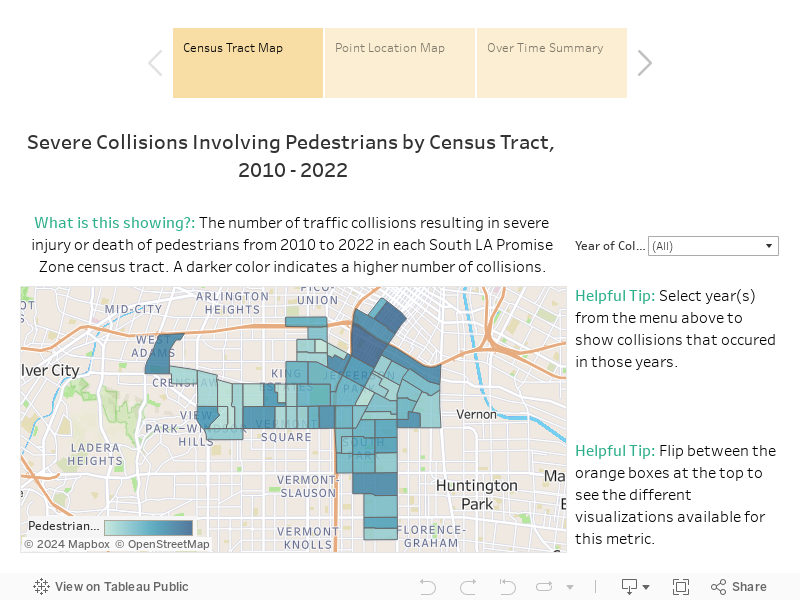
- Over the last decade, the rate of traffic collisions with pedestrians has been consistently higher in the South LA Promise Zone than in the larger City of Los Angeles.
- From 2016 to 2021, the number of collisions with pedestrians in the South LA Promise Zone has been steadily decreasing. However, this number slightly increased from 2021 to 2022.
Tree Cover
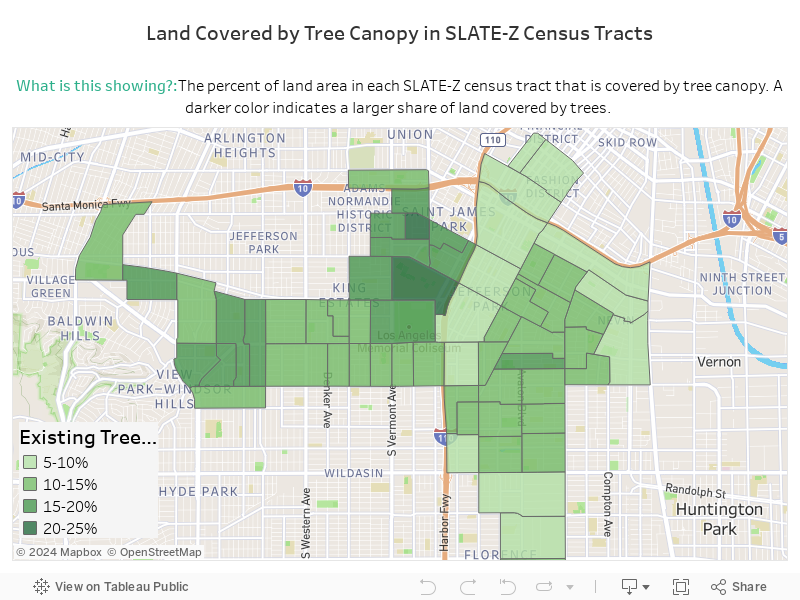
- 12% of land in the South LA Promise Zone is covered by tree canopy compared to 25% of land across the City of Los Angeles.